Portfolio case study
Chicago Parks Lakehouse
A medallion lakehouse on Azure Databricks over Chicago Park District open data: 8,669 programs and events across 617 parks, from raw files in a data lake to a star schema in Unity Catalog and a Power BI report, on compute that costs nothing while idle.
Chicago Data Portal→ADLS landings→Bronze→Silver→Gold→Power BI
The question the platform answers
“What does the Park District offer, where, for whom, and at what price?”
- Source: eight Chicago Data Portal datasets, landed raw in Azure Data Lake Storage by an existing loader on the 1st of each month.
- Platform: a serverless Azure Databricks workspace, Unity Catalog, Delta tables, PySpark and SQL notebooks, one job.
- Serving: gold stays in the lakehouse. Power BI imports it through a serverless SQL warehouse that stops after one idle minute.
- Security: Databricks reaches the lake as a managed identity, with no keys. It can read the raw zone and write only its own container.
- Cost: no cluster, virtual network or NAT gateway exists between runs. Compute is billed for the seconds a run takes.
Figures from the run on 13 November 2026.
- Azure Databricks
- Unity Catalog
- Delta Lake
- Auto Loader
- PySpark
- Spark SQL
- VARIANT
- Spatial SQL
- ADLS Gen2
- Serverless SQL warehouse
- TMDL / PBIR
- Bicep
- Entra ID
Architecture
A medallion lakehouse on Azure Databricks
Left to right. A loader that already existed lands each API response in the lake exactly as received. Databricks takes it from there: Auto Loader copies new landings into bronze, SQL and PySpark notebooks refine bronze to silver and silver to gold, and Power BI reads gold. The workspace and its lake access are defined in Bicep; the catalog, the job and the report are deployed by script.
- Source
Chicago Data Portal: activities, permits, library events, five boundary sets.
originpublic open data - Landing
ADLS Gen2. Raw JSON pages and a manifest per landing.
Azure Functionwritten once, never edited - Bronze
chicago_parks.bronze. One row per source record, kept whole.
Auto Loader01_bronze_ingest - Silver
chicago_parks.silver. Typed tables, parks matched to facilities.
SQL + PySpark02_silver_parks - Gold
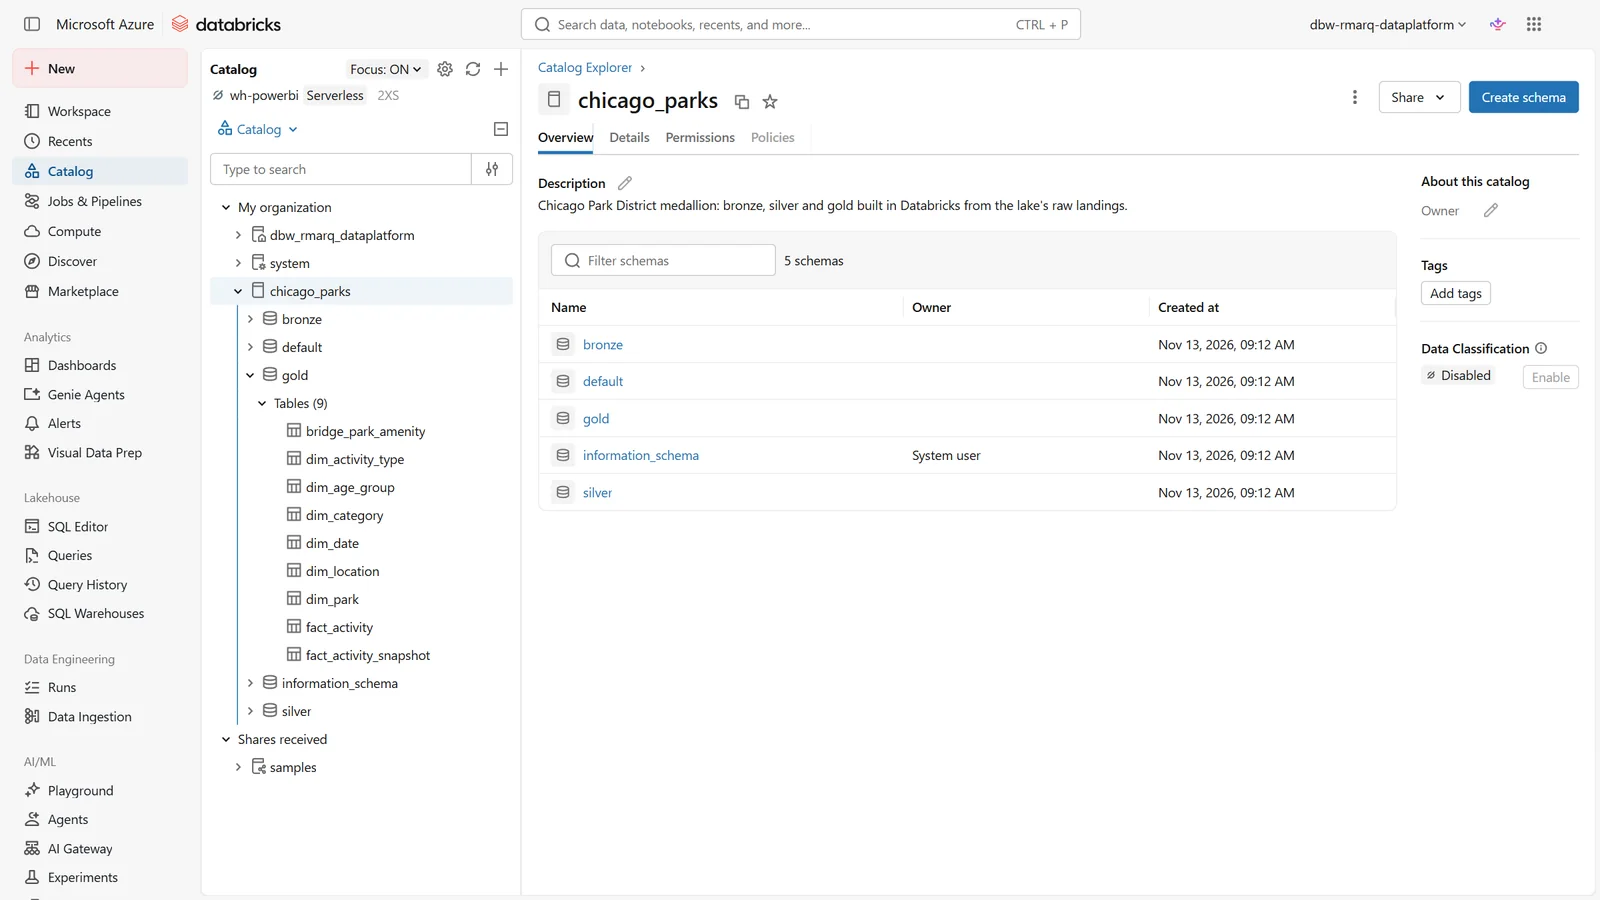
chicago_parks.gold. Delta star schema, 9 tables.
SQL + PySpark03_gold_parks - Consume
Power BI report: 6 pages, 23 measures.
Importserverless SQL warehouse
Why serverless
A classic Databricks workspace puts a virtual network in the subscription, and with the default settings Azure adds a NAT gateway that bills around the clock whether or not anything runs. A serverless workspace has neither: compute runs in Databricks’ network and is billed per second of use. For a small monthly workload that is the difference between a fixed monthly charge and a few minutes of compute. The trade-off is no classic clusters to size and tune.
Access, by design
| Object | Kind | What it allows |
|---|---|---|
| dbac-rmarq-lake | Access connector | A managed identity. Unity Catalog signs in to the lake as this; no storage key exists anywhere. |
| cred_rmarq_lake | Storage credential | Unity Catalog’s name for that identity. |
| lake_bronze, lake_silver | External locations, read-only | The loader’s raw and refined zones. Databricks can read them and nothing more. |
| lake_databricks | External location | The one container Databricks writes. Its tables can never collide with the loader’s. |
| chicago_parks | Catalog | Schemas bronze, silver, gold; managed Delta tables stored under lake_databricks. |
A run
One run, start to finish
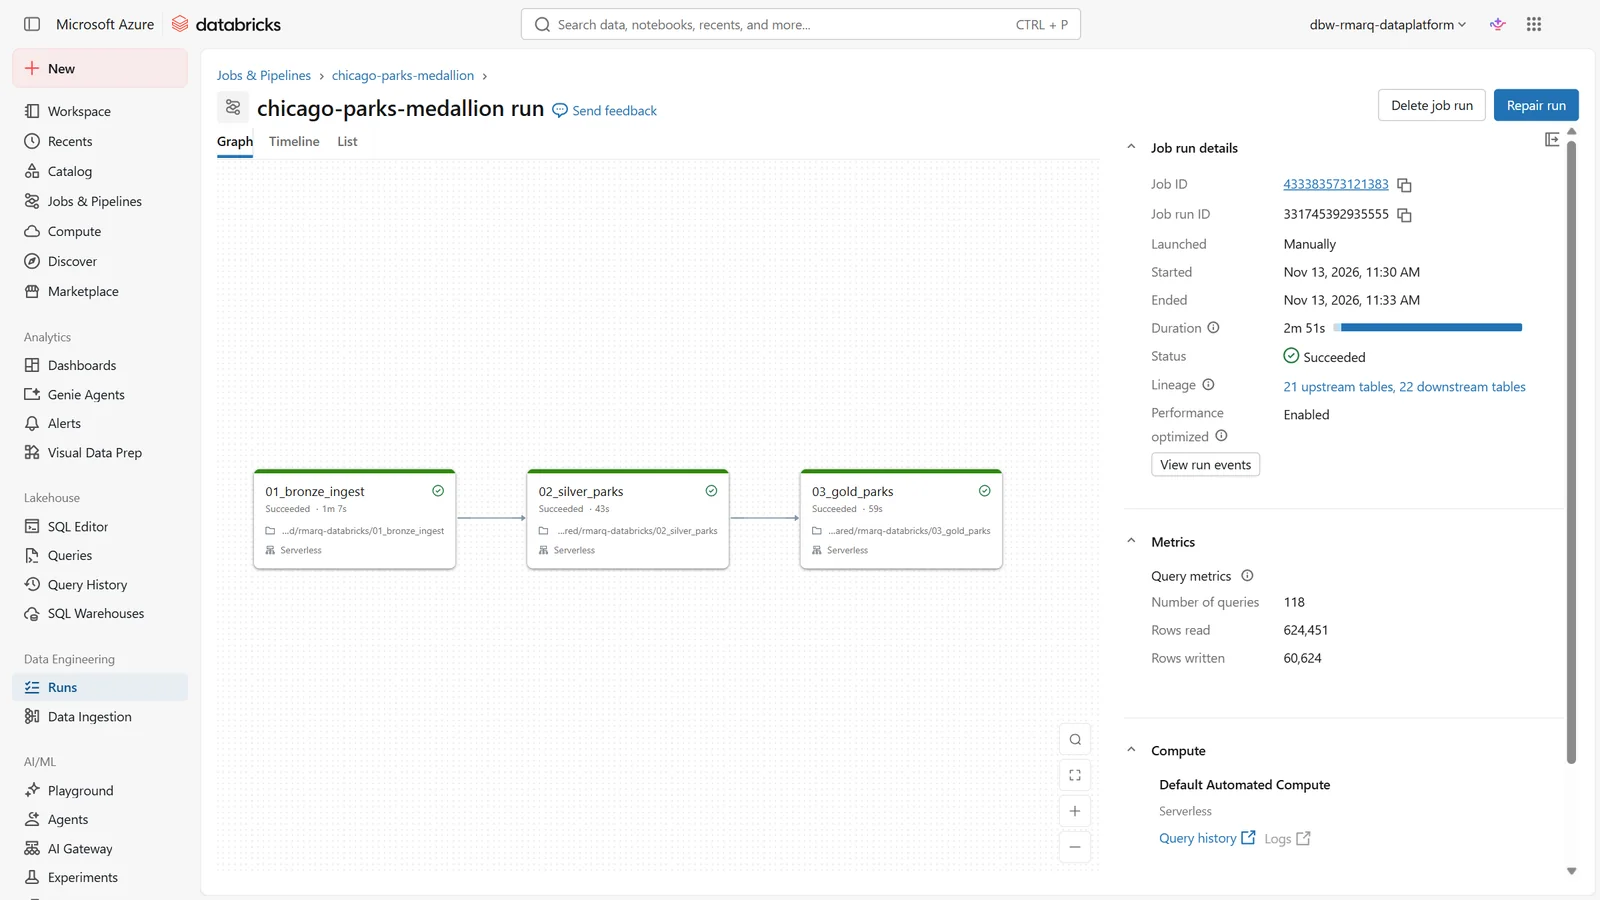
Task timings from a run on 13 November 2026, laid end to end. Nothing is resumed beforehand or paused afterwards, because nothing is running between runs. Everything after bronze is rebuilt in full: at this size that takes seconds and needs no merge logic.
- BronzeAuto Loader appends the landings it has not loaded, then reconciles row counts with the loader’s manifests.
- SilverType the records, unpivot amenities, match facilities to parks. Then check grain and completeness.
- GoldDimensions, facts, the snapshot fact. Then check every key and every fact-to-dimension join.
- DoneCompute is released. Power BI refreshes on demand.
Layer 1
Bronze: every record, kept whole
Auto Loader remembers which files it has loaded, so each run picks up only new landings; a second run over the same files adds nothing. Each record is stored whole in a VARIANT column, so a column the source adds or drops cannot break ingestion. The lake keeps only the newest seven landings per dataset; bronze keeps all of them, which is where history comes from.
- Where
- chicago_parks.bronze, one Delta table per dataset.
- Grain
- One row per source record per landing.
- Lineage
- Source file, landing date, run id and load time on every row.
- Volume
- 66,329 rows across eight datasets on 13 November 2026.
- Checked
- Each landing’s row count equals the count in its manifest.
01_bronze_ingest
- Auto Loader reads new page files
- Split each page into records
- Store as VARIANT with lineage
- Reconcile with the manifests
# each page file is one JSON array
files = (spark.readStream.format("cloudFiles")
    .option("cloudFiles.format", "text")
    .option("wholeText", "true")
    .option("pathGlobFilter", "page_*.json")
    .load(f"{SOURCE}/{dataset}/"))

records = files.select(
    F.parse_json("_json").alias("record"),
    load_date, run_id, source_file, ingested_at)

(records.writeStream
    .option("checkpointLocation", f"{STATE}/{dataset}")
    .trigger(availableNow=True)  # batch, not 24/7
    .toTable(f"chicago_parks.bronze.{dataset}"))
Layer 2
Silver: typed, and tied to a park
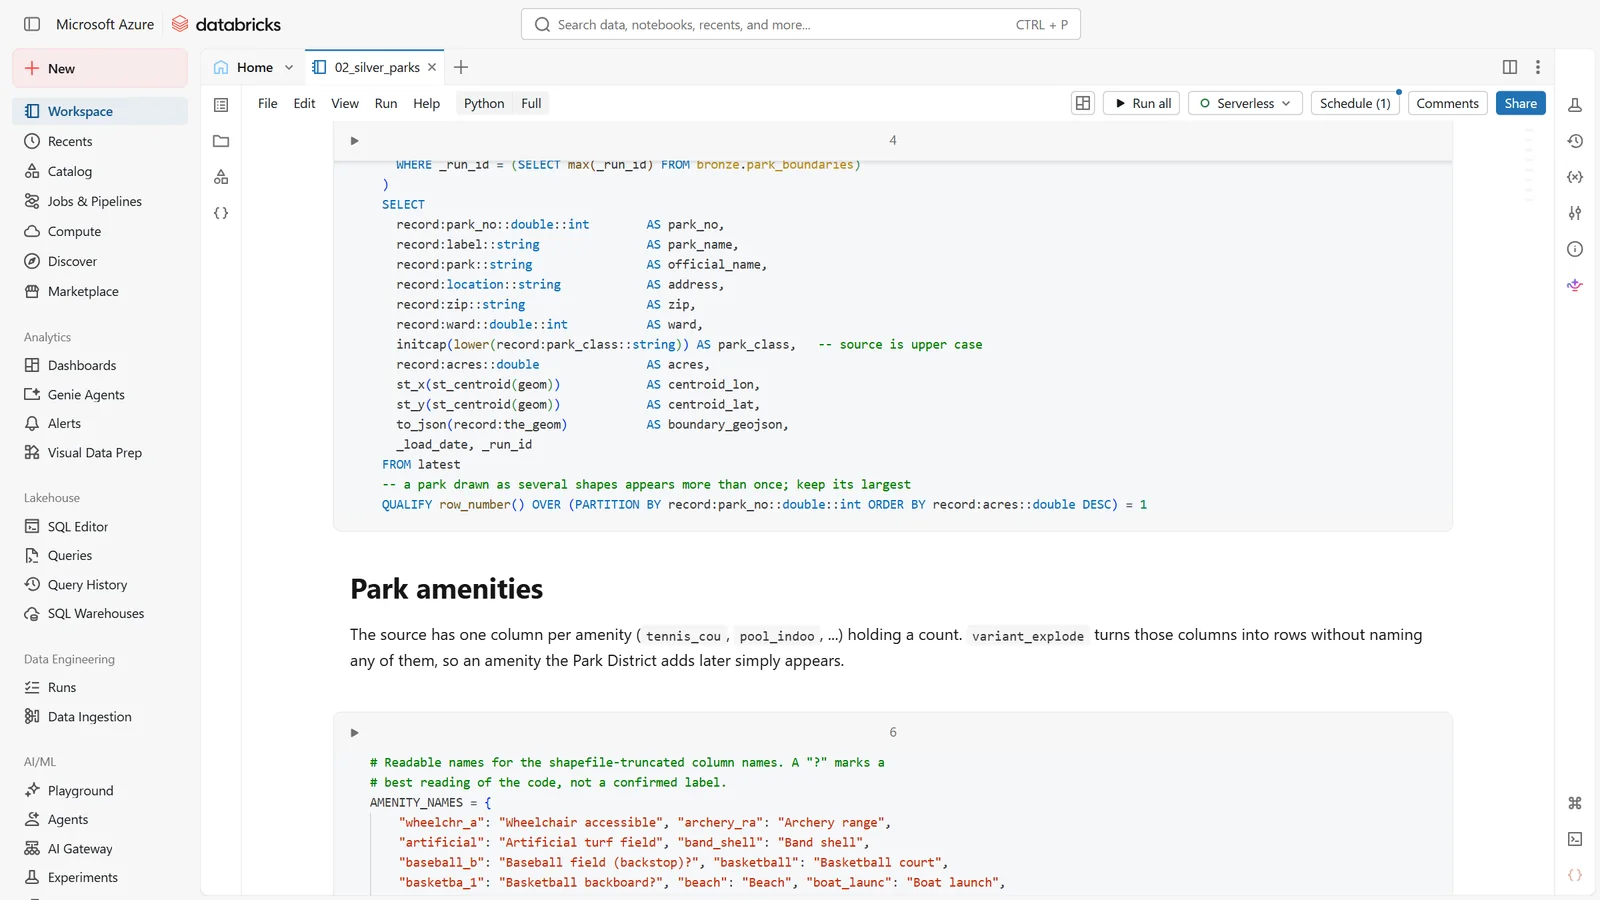
Silver names and types the columns, splits free text such as “At least 6 but less than 13” into bounds that can be filtered, and turns the park dataset’s seventy amenity columns into rows. The hard part is that an activity names a facility and gives coordinates but never a park number, so each facility is matched to a park twice over.
- park
- 617 rows, one per park, with its boundary.
- park_amenity
- 2,615 rows, one per park and amenity it has.
- park_facility
- 271 rows, one per place an activity is held.
- park_activity
- 8,669 rows, the current listing.
- park_activity_history
- 17,671 rows, every activity in every landing.
Matching a facility to its park
| Method | Rule | Facilities |
|---|---|---|
| Name | The facility name, less the word “Park”, equals the park’s official name. | 207 |
| Location | The facility’s coordinates fall inside a park boundary. | 50 |
| None | Offsite and online locations; kept, with no park. | 14 |
-- the spatial half of the match
SELECT f.facility_name,
       min_by(p.park_no, p.acres) AS park_no
FROM facility f
JOIN silver.park p
  ON st_contains(
       st_geomfromgeojson(p.boundary_geojson),
       st_point(f.longitude, f.latitude, 4326))
GROUP BY f.facility_name

-- amenity columns to rows, without naming them
FROM bronze.park_boundaries b,
     LATERAL variant_explode(b.record) f
Layer 3
Gold: a Kimball star schema
Two facts share five conformed dimensions, so a slicer on category or age group filters the current listing and its history alike. Dimension keys are hashes of the natural key, so a key means the same thing on every rebuild with no lookup step. The run fails if any key is not unique or any fact row has no matching dimension row.
- dim_date712 rows
- dim_park618 rows
- dim_location271 rows
- dim_category124 rows
- dim_activity_type11 rows
- dim_age_group90 rows
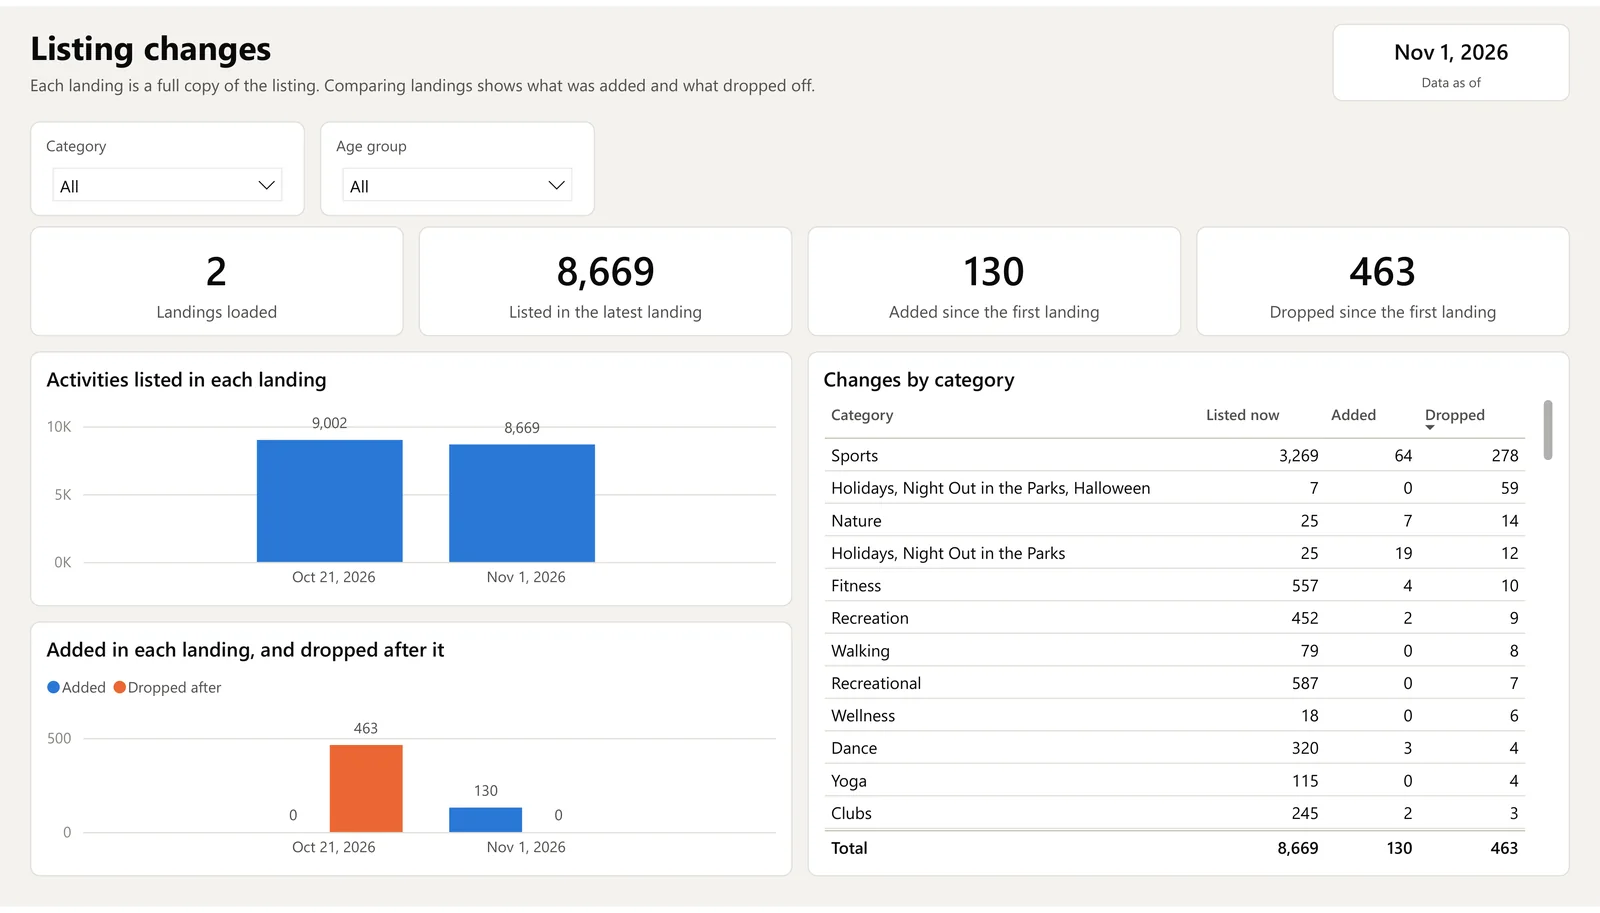
The snapshot fact is what a single pull of a current-state listing cannot give by itself. Between the landings of 21 October and 1 November 2026, 463 activities left the listing and 130 joined it. With only two landings the history is thin; it deepens with each monthly landing.
Serving
Serving: straight from the lakehouse
Gold is not copied into a database. Power BI imports it through a serverless SQL warehouse of the smallest size, which starts when a refresh asks for it and stops a minute after. The semantic model and the report are generated by a script from the gold schema, as TMDL and PBIR, so nothing is edited by hand and a change is a change to the script.
- Model: 9 tables, 14 relationships, 23 measures in display folders, hidden keys, friendly names, sort-by columns.
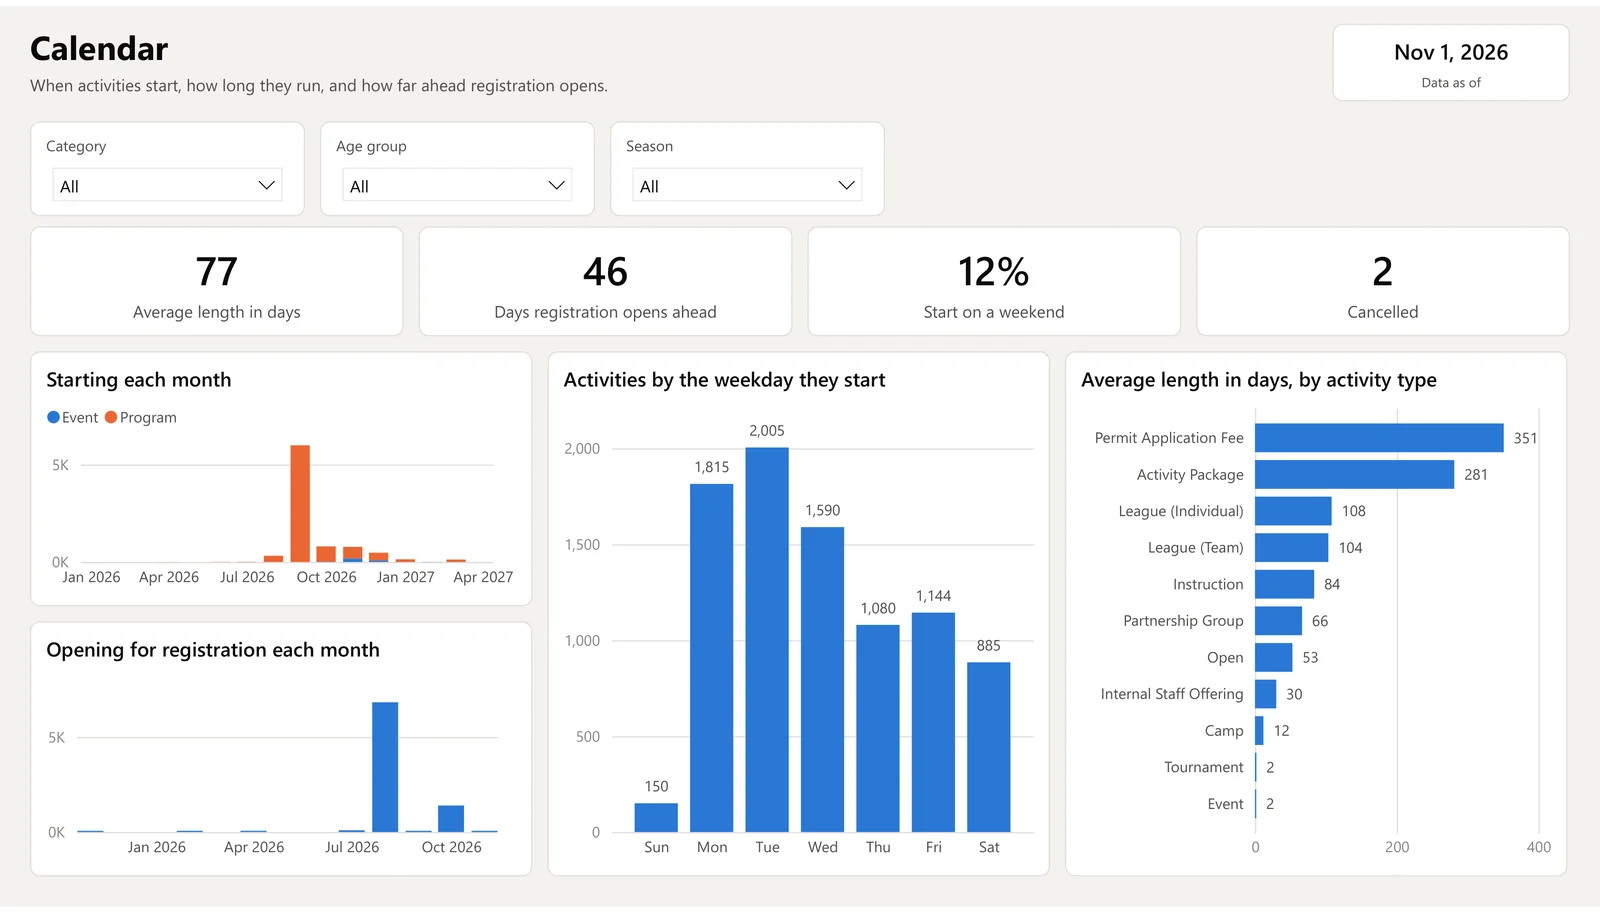
- Dates: an activity has a start date and a registration date. Slicing by date means the start; the registration view goes through an inactive relationship.
- Parameters: the workspace address and warehouse path, so pointing the model at another workspace is one edit.
- Theme: one theme file sets a colorblind-safe palette, type and spacing for every page.
measure 'Avg Paid Fee' =
    CALCULATE(AVERAGE('Activity'[Fee]),
      'Activity'[Is Free] = FALSE())
  formatString: \$#,0
  displayFolder: Pricing

measure 'Registrations Opening' =
    CALCULATE([Activities],
      USERELATIONSHIP(
        'Activity'[Registration Date Key],
        'Date'[Date Key]))

partition Activity = m
  mode: import
  source = Databricks.Catalogs(
    ServerHostName, HttpPath, ...)
Databricks
The workspace
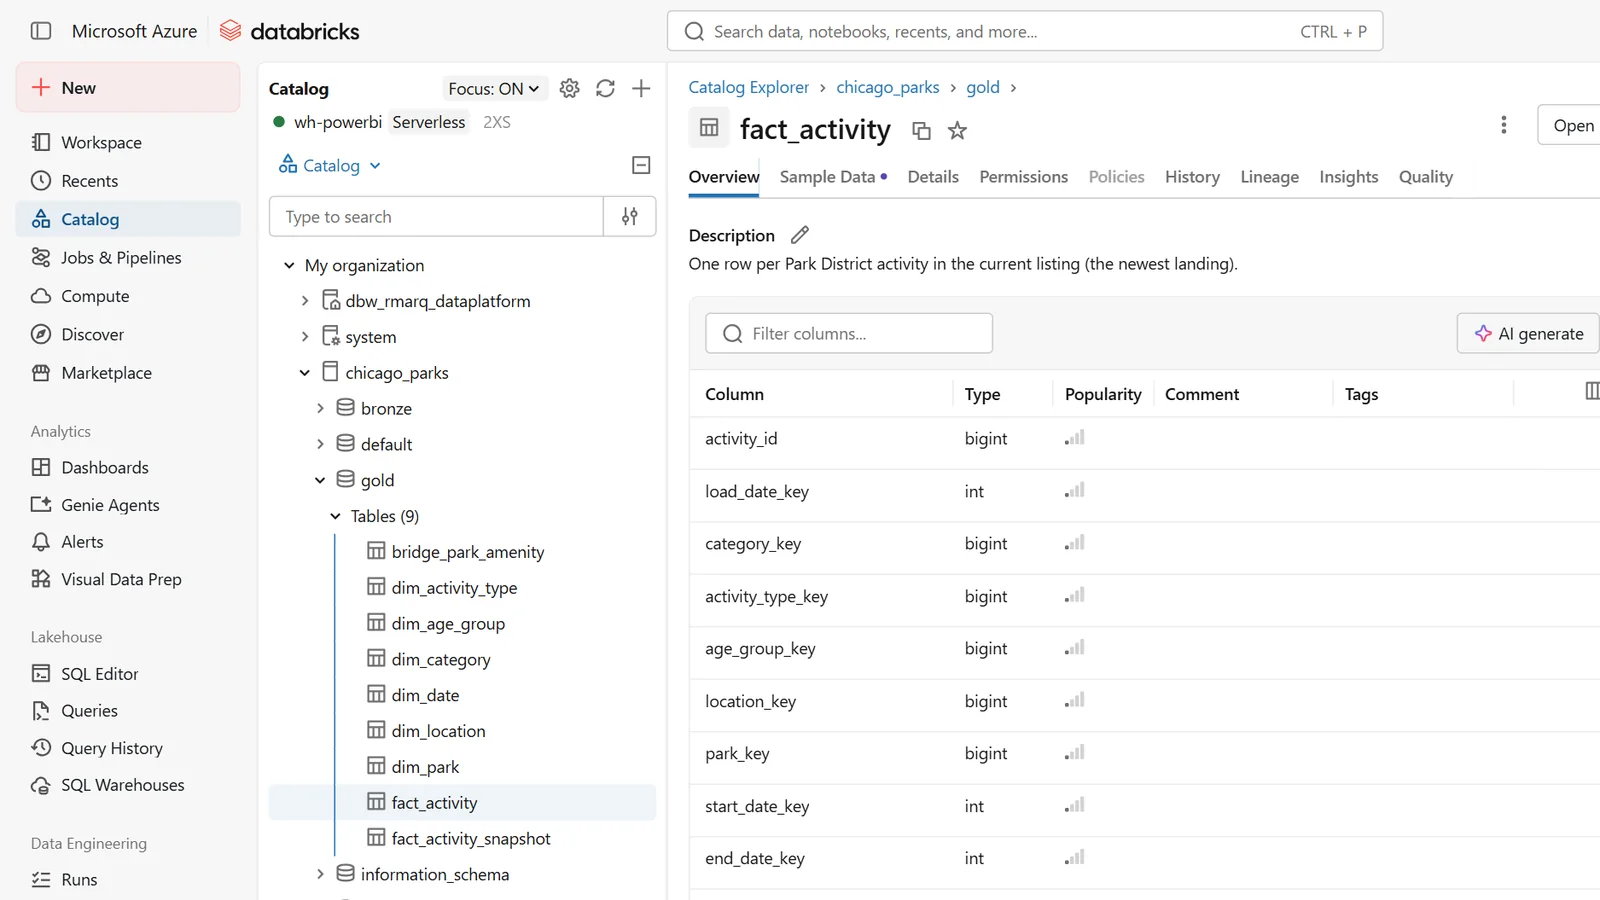
Unity Catalog draws lineage from what the notebooks read and write, table by table. The job view shows each task, its duration and its result.
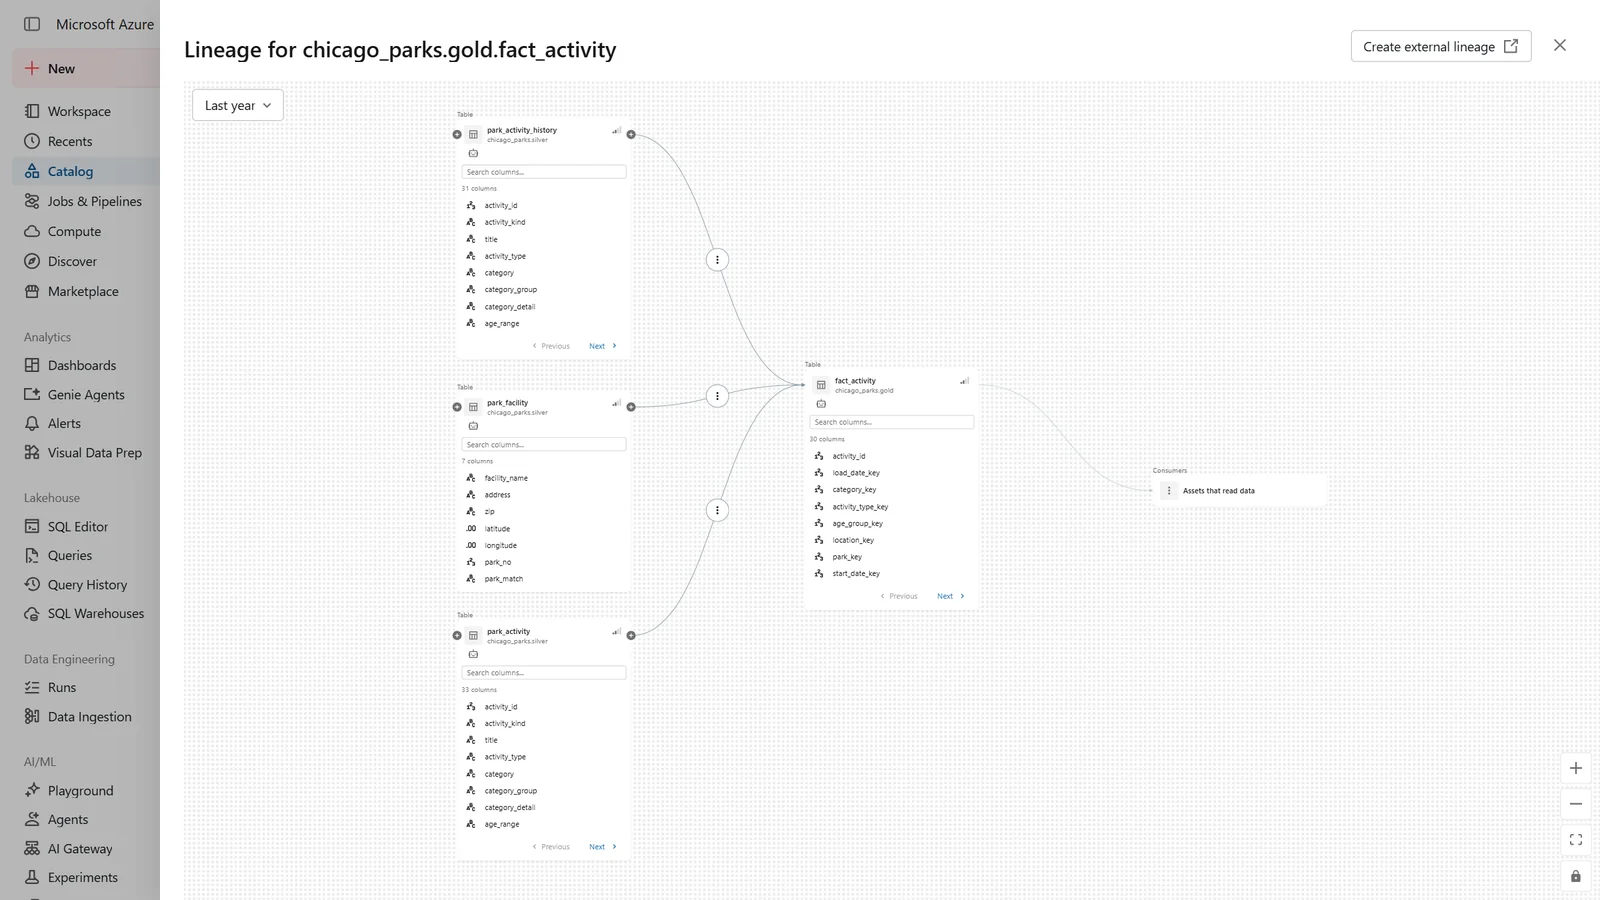
fact_activity and the three silver tables it is built from, column by column, captured by Unity Catalog with no extra code.
Power BI
The report
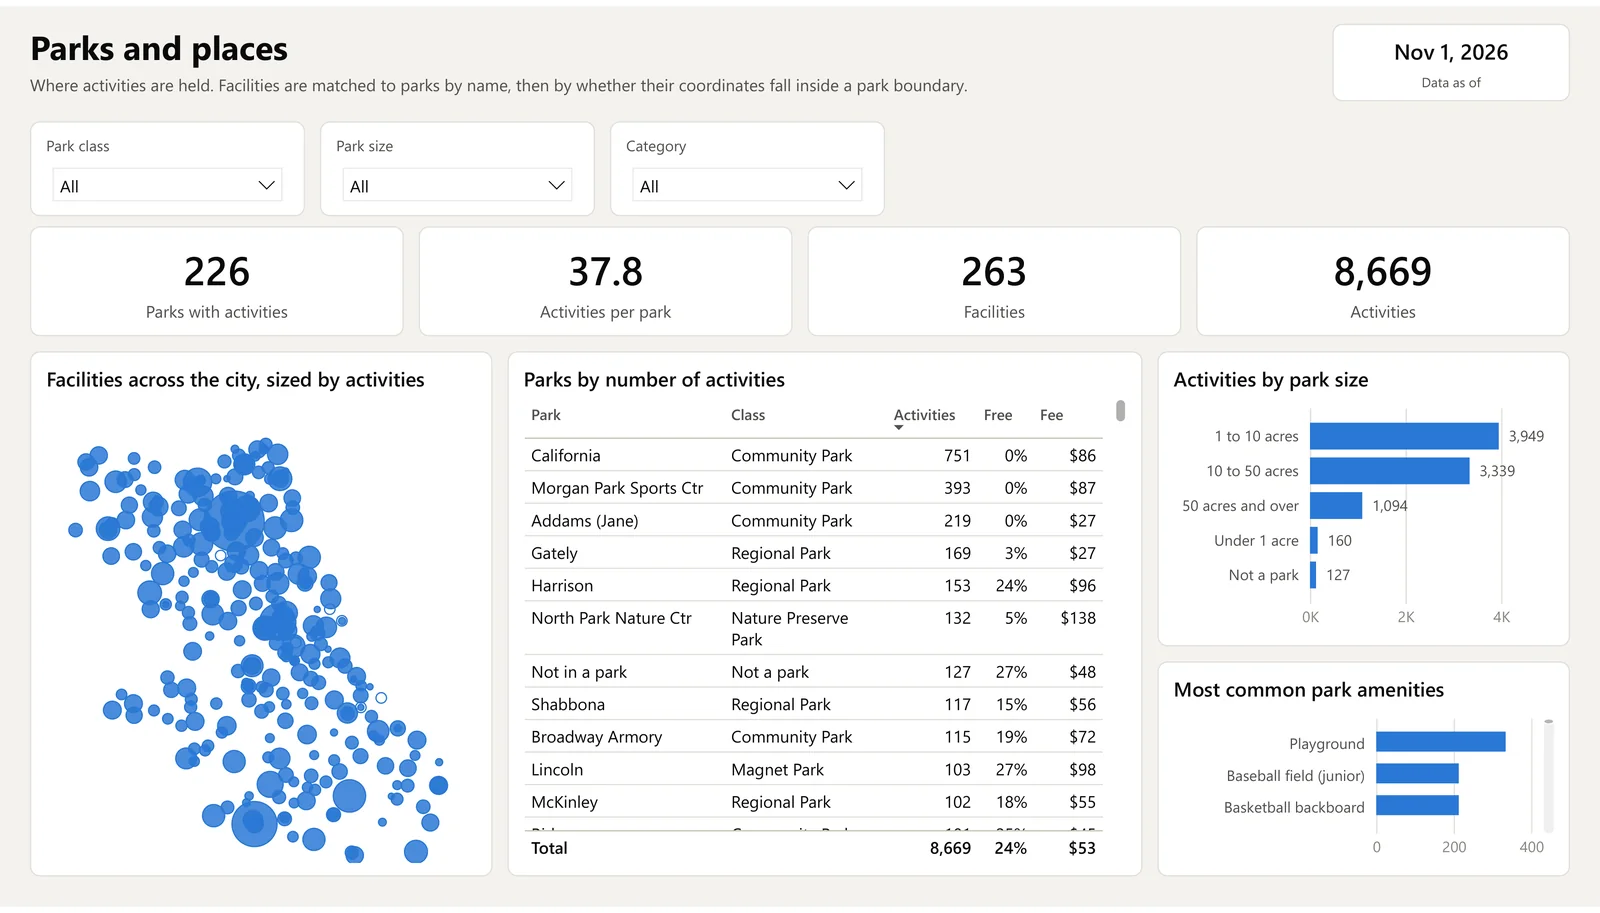
Six pages over 8,669 activities. Every page carries its filters in one row and the date the data was loaded. The figures below are from the landing of 1 November 2026.
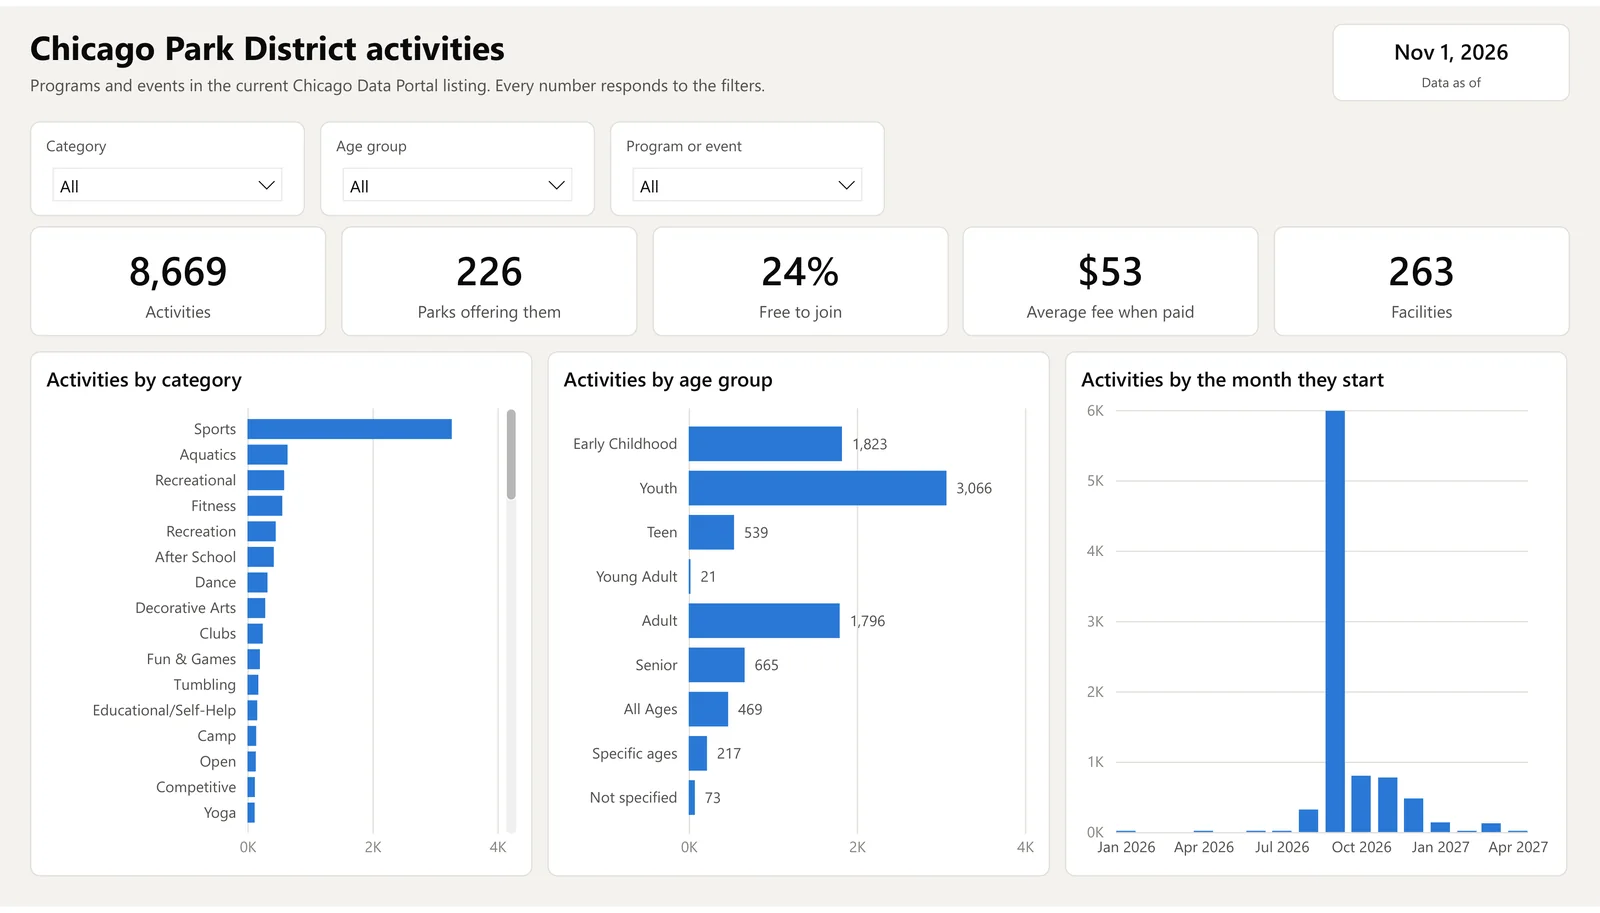
Overview
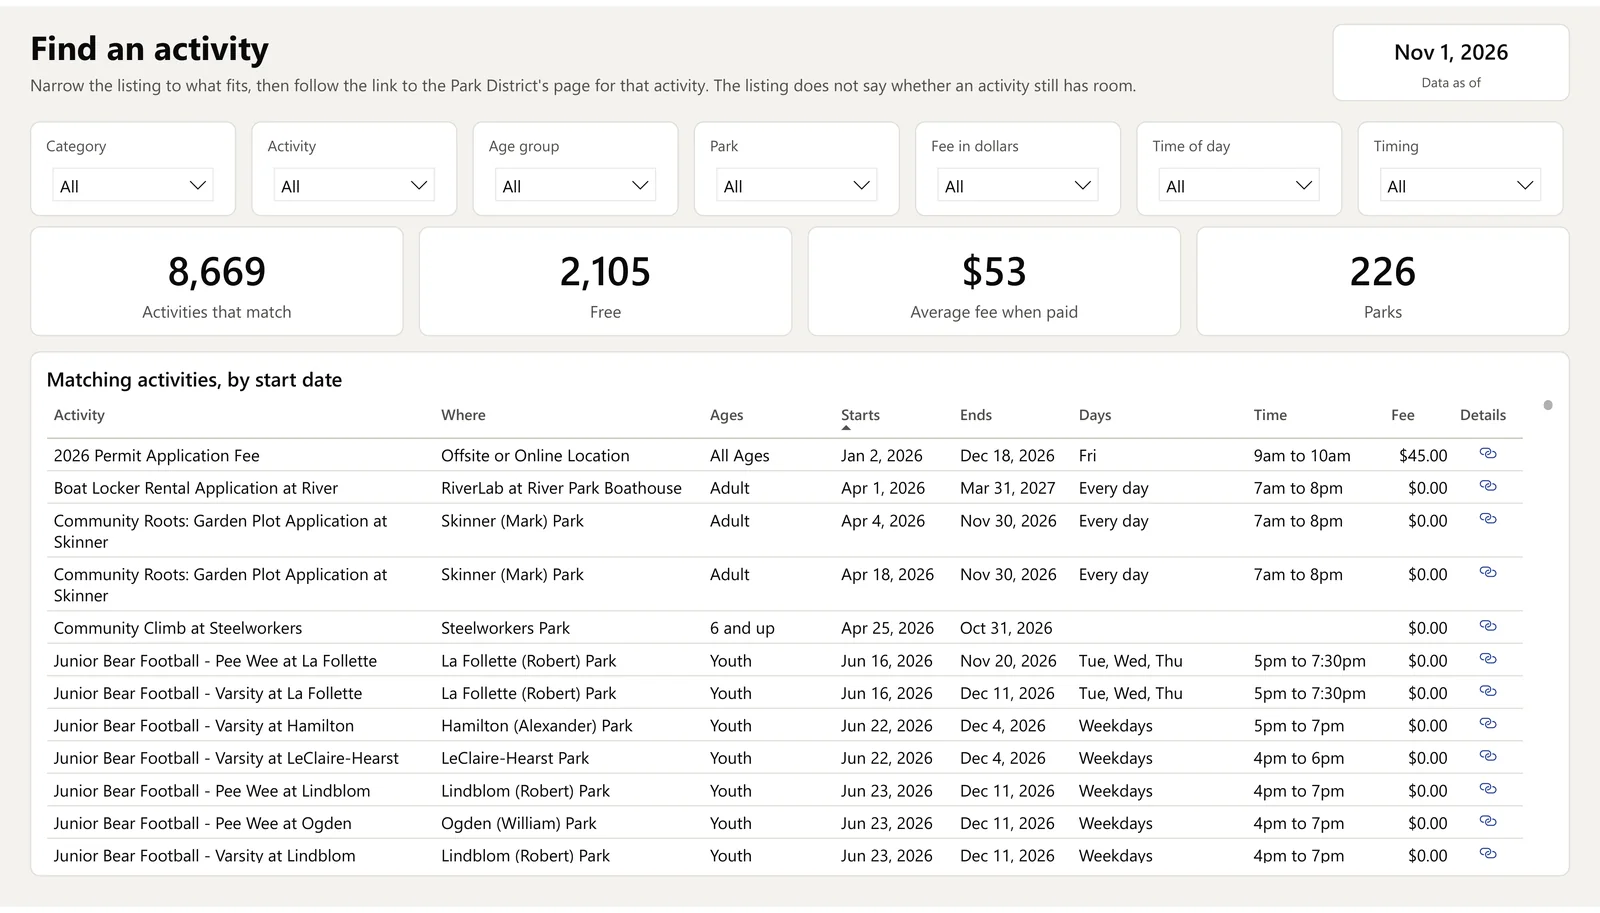
Find an activity
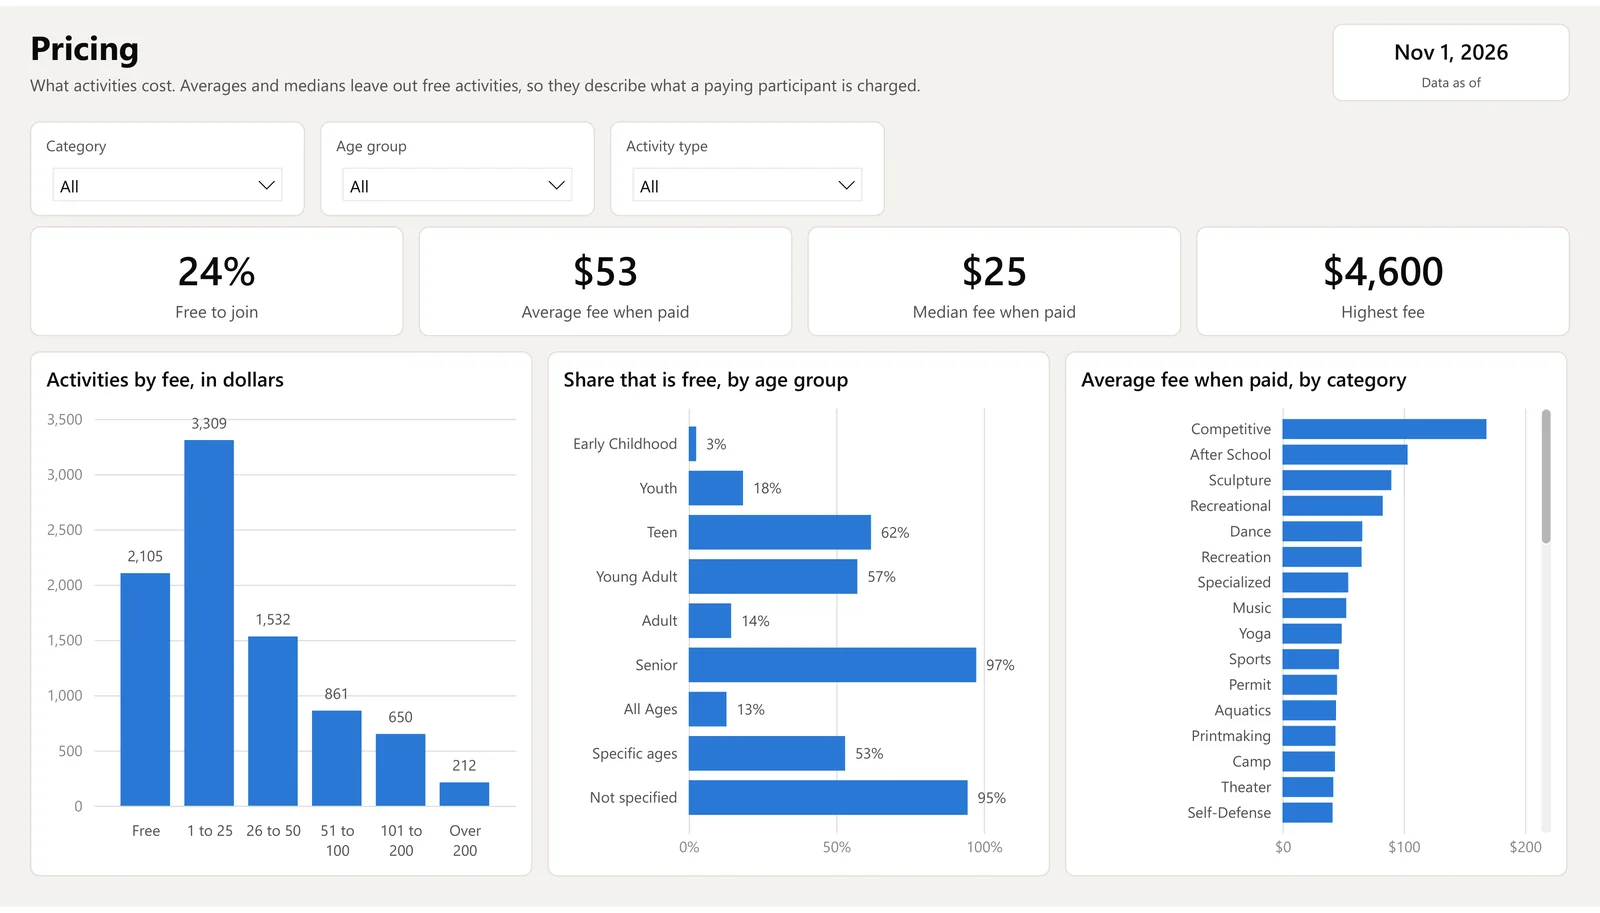
Pricing
In short
- Architecture: a medallion lakehouse on Azure Databricks and Unity Catalog, over a lake that already existed.
- Engineering: Auto Loader, VARIANT, spatial SQL, checks that stop a run.
- Modeling: a Kimball star schema with a snapshot fact for change over time.
- BI: a Power BI model and report generated from code, served from the lakehouse.
- Cost: serverless throughout, so an idle platform costs nothing.
The repository is private and available on request. The same idea built on Microsoft Fabric is the Chess Data Platform case study.